A shape is something like a rectangle or an ellipse in 2 dimensions or a sphere or box in 3 dimensions.
Its main purpose here, especially in 2 dimensions, is to provide a way to graphically show sets. That is, the shape could be drawn around other elements to show that they are a set. For example we could draw Venn diagrams or show how one set of elements maps to another set of elements.
Of course we could create a shape by plotting the equation for that shape, for example, by using 'ParametricPlaneCurve'. However that would be unnecessarily complicated when we just want a shape to visually show a grouping of elements, the mathematical properties of the shape are not the issue here.
The shape is stored as follows:
SHAPE ==> Record(shptype:Symbol,centre:PT,size:PT,fill:Boolean) |
where:
- 'shptype' may have the following values:
- "rect"::Symbol
- "ellipse"::Symbol
- "box"::Symbol
- "sphere"::Symbol
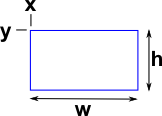
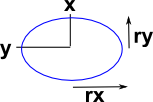
- centre determines where the shape is drawn.
- size determines the extent of the shape (which may be different in each dimension).
- fill, if set to true, will fill the shape with the current fill colour. otherwise, if set to false, the inside of the shape is transparent.
 |
 |
In the case of rectangle: size determines the full height and width. |
In the case of ellipse: size determines the radius in each dimension (half the full height and width). |
Shape is constructed as follows:
createSceneShape:(shape:SHAPE) -> %
    ++ createSceneShape(shape) constructs a shape node, this contains
    ++ a shape such as a rectangle or an ellipse.
  addSceneShape:(n:%,shape:SHAPE) -> %
    ++ addSceneShape(n,shape) is a convenience function which combines
    ++ createSceneShape with addChild!
|
Tutorial
| First we will create a simple ellipse shape, the code to do this is shown below: |  |
(1) -> DF ==> DoubleFloat
                                                             Type: Void

(2) -> PT ==> SCartesian(2)
                                                             Type: Void

(3) -> view := boxBoundary(sipnt(0,-500)$PT,sipnt(1200,500)$PT)
   (3)  bound box:pt(0.0,- 500.0)->pt(1200.0,500.0)
                                         Type: SBoundary(SCartesian(2))

(4) -> sc := createSceneRoot(view)$Scene(PT)
   (4)  scene root bound box:pt(0.0,- 500.0)->pt(1200.0,500.0) #ch=0
                                             Type: Scene(SCartesian(2))

(5) -> SHAPE ==> Record(shptype:Symbol,centre:PT,size:PT,fill:Boolean)
                                                             Type: Void

(6) -> sh:SHAPE := ["ellipse"::Symbol,_
                               sipnt(600,0)$PT,sipnt(100,200)$PT,false]
   (6)
[shptype= ellipse,centre= pt(600.0,0.0),size= pt(100.0,200.0),fill= false]
                                          Type: Record(shptype: Symbol,_
                centre: SCartesian(2),size: SCartesian(2),fill: Boolean)

(7) -> tr2 := addSceneShape(sc,sh)$Scene(PT)
   (7)  scene shape type=ellipse_
                            pt1=pt(600.0,0.0) pt2=pt(100.0,200.0) #ch=0
                                             Type: Scene(SCartesian(2))

(8) -> writeSvg(sc,"testGraph/exampleshape1.svg")
Type: Void |
| We can create Venn diagrams as here. I have used one rectangle and one ellipse to show the different options, we wouldn't necessarily do that in a real case. | 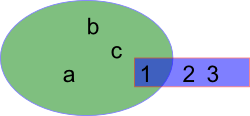 |
(1) -> DF ==> DoubleFloat
                                                             Type: Void

(2) -> PT ==> SCartesian(2)
                                                             Type: Void

(3) -> view := boxBoundary(sipnt(0,-500)$PT,sipnt(1200,500)$PT)
   (3)  bound box:pt(0.0,- 500.0)->pt(1200.0,500.0)
                                         Type: SBoundary(SCartesian(2))

(4) -> sc := createSceneRoot(view)$Scene(PT)
   (4)  scene root bound box:pt(0.0,- 500.0)->pt(1200.0,500.0) #ch=0
                                             Type: Scene(SCartesian(2))

(5) -> MATERIAL ==> Record(lineWidth:DF,_
                           lineCol:String,fillCol:String,matOpacity:DF)
                                                             Type: Void

(6) -> SHAPE ==> Record(shptype:Symbol,centre:PT,size:PT,fill:Boolean)
                                                             Type: Void

(7) -> sh1:SHAPE := ["ellipse"::Symbol,_
                                sipnt(400,0)$PT,sipnt(300,200)$PT,true]
   (7)
   [shptype= ellipse,centre= pt(400.0,0.0),_
                                      size= pt(300.0,200.0),fill= true]
                   Type: Record(shptype: Symbol,centre: SCartesian(2),_
                                     size: SCartesian(2),fill: Boolean)

(8) -> mat1:MATERIAL := [3::DF,"blue","green",0.5::DF]
  (8) [lineWidth= 3.0,lineCol= "blue",fillCol= "green",matOpacity= 0.5]
                                 Type: Record(lineWidth: DoubleFloat,_
               lineCol: String,fillCol: String,matOpacity: DoubleFloat)

(9) -> mt1 := addSceneMaterial(sc,mat1)$Scene(PT)
   (9)  scene material lw=3.0 lc="blue" fc="green" mo=0.5 #ch=0
                                             Type: Scene(SCartesian(2))

(10) -> tr2 := addSceneShape(mt1,sh1)$Scene(PT)
   (10)  scene shape type=ellipse_
                           pt1=pt(400.0,0.0) pt2=pt(300.0,200.0) #ch=0
                                             Type: Scene(SCartesian(2))

(11) -> sh2:SHAPE := ["rect"::Symbol,_
                                sipnt(600,0)$PT,sipnt(400,100)$PT,true]
   (11)
 [shptype= rect,centre= pt(600.0,0.0),size= pt(400.0,100.0),fill= true]
                                        Type: Record(shptype: Symbol,_
              centre: SCartesian(2),size: SCartesian(2),fill: Boolean)

(12) -> mat2:MATERIAL := [3::DF,"red","blue",0.5::DF]
   (12) [lineWidth= 3.0,lineCol= "red",fillCol= "blue",matOpacity= 0.5]
                                  Type: Record(lineWidth: DoubleFloat,_
               lineCol: String,fillCol: String,matOpacity: DoubleFloat)

(13) -> mt2 := addSceneMaterial(sc,mat2)$Scene(PT)
   (13)  scene material lw=3.0 lc="red" fc="blue" mo=0.5 #ch=0
                                             Type: Scene(SCartesian(2))

(14) -> tr2 := addSceneShape(mt2,sh2)$Scene(PT)
   (14)  scene shape type=rect_
                           pt1=pt(600.0,0.0) pt2=pt(400.0,100.0) #ch=0
                                             Type: Scene(SCartesian(2))

(15) -> addSceneText(sc,"a",80::NNI,sipnt(300,-100)$PT)$Scene(PT)
   (15)  scene text="a" sz=80 p=pt(300.0,- 100.0) npt=[] #ch=0
                                             Type: Scene(SCartesian(2))

(16) -> addSceneText(sc,"b",80::NNI,sipnt(400,100)$PT)$Scene(PT)
   (16)  scene text="b" sz=80 p=pt(400.0,100.0) npt=[] #ch=0
                                             Type: Scene(SCartesian(2))

(17) -> addSceneText(sc,"c",80::NNI,sipnt(500,0)$PT)$Scene(PT)
   (17)  scene text="c" sz=80 p=pt(500.0,0.0) npt=[] #ch=0
                                             Type: Scene(SCartesian(2))

(18) -> addSceneText(sc,"1",80::NNI,sipnt(620,-100)$PT)$Scene(PT)
   (18)  scene text="1" sz=80 p=pt(620.0,- 100.0) npt=[] #ch=0
                                             Type: Scene(SCartesian(2))

(19) -> addSceneText(sc,"2",80::NNI,sipnt(800,-100)$PT)$Scene(PT)
   (19)  scene text="2" sz=80 p=pt(800.0,- 100.0) npt=[] #ch=0
                                             Type: Scene(SCartesian(2))

(20) -> addSceneText(sc,"3",80::NNI,sipnt(900,-100)$PT)$Scene(PT)
   (20)  scene text="3" sz=80 p=pt(900.0,- 100.0) npt=[] #ch=0
                                             Type: Scene(SCartesian(2))

(21) -> writeSvg(sc,"testGraph/exampleshape2.svg")
Type: Void |
Further Information
- User Reference on this page.
- Programmers Reference on this page.
- Examples of scenegraph structure on this page.
- The code is in file: scene.spad.pamphlet which is available from here.
- Existing Axiom graphics framework on this page.